At its core, CnSight is a platform that centralizes key cybersecurity data from all the disparate security tools across your organizational structure to transform how manage the business of cybersecurity. Understanding the Operational and Executive dashboards are critical to getting the most value out of CnSight. Thankfully, we’ve gone to great lengths to make it as easy and intuitive as possible, so you should be able to hit the ground running.
The Operational Dashboard
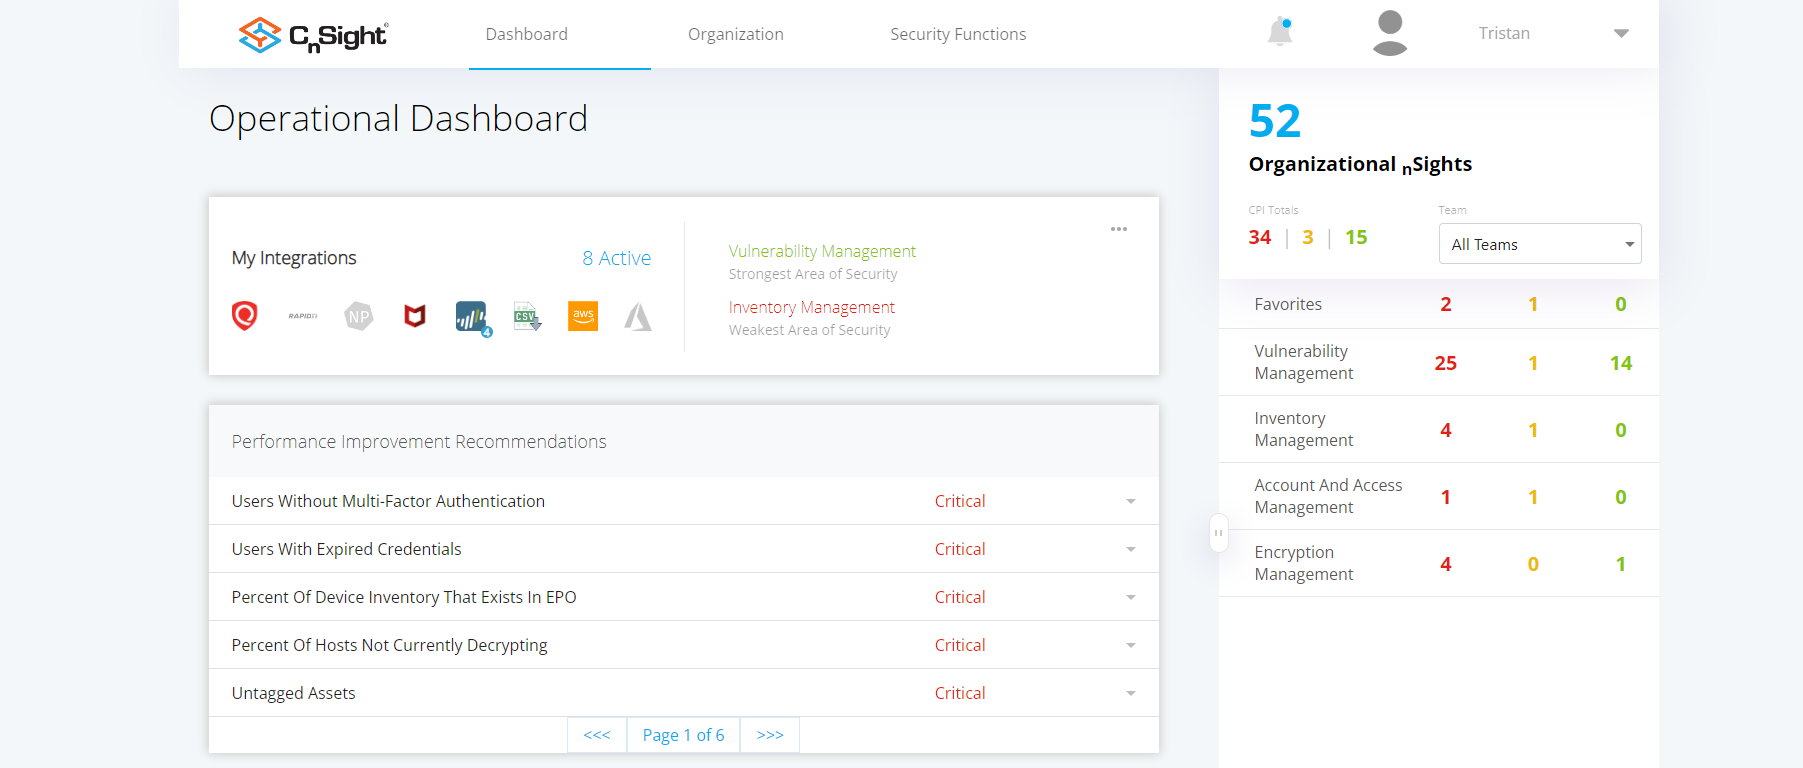
When you first approach CnSight, the Operational Dashboard will be the very first thing you see. It has everything that you need to get a high-level understanding of your cybersecurity performance at a glance. There are three key sections that are useful here, namely the Organizational nSights panel on the right-hand side, the performance improvement recommendations, and the trend line charts for percentage and age-based CPIs.
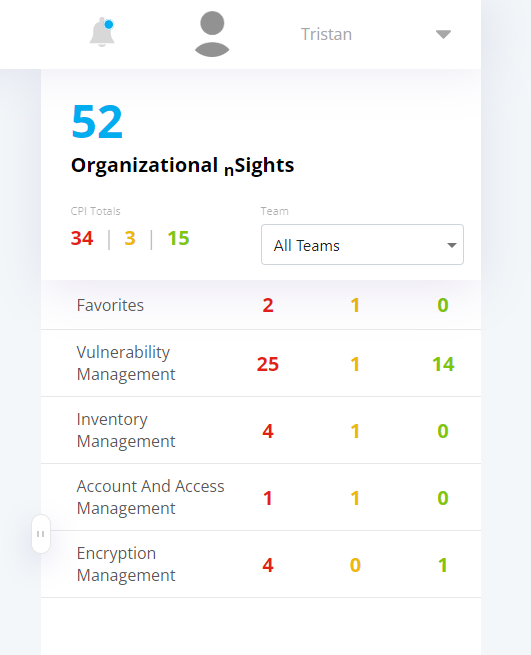
The Organizational nSights panel allows you to quickly and easily see a high-level overview of the performance of CPIs across the many Security Functions that categorize CPIs. Each security function will display the number of CPIs that are being tracked and their respective level of protection and performance. In the above example, there are a total of 40 CPIs in the Vulnerability Management security function, 25 of which are critically below the organizationally defined SLA, 14 are within or above the SLA, and 1 is somewhere in the middle. Every CPI can be clicked on to drill down into much greater detail.
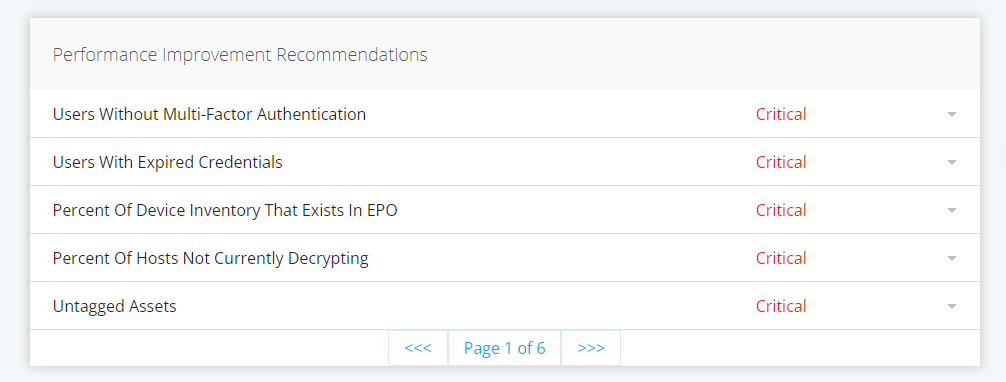
The Performance Improvement Recommendations table is there to highlight CPIs whose poor performance has the greatest impact on overall cybersecurity performance. Every CPI is given a weighting based on its importance, such that CPIs that track incredibly impactful cybersecurity controls are weighted more heavily. As an example, the CPI that tracks multifactor authentication enrollment is weighted far more heavily than the CPI that tracks the percentage of systems that have a low severity vulnerability.
This weighting means that performance improvement recommendations will be sorted from most to least impactful to cybersecurity performance. This makes it easy to visualize where security improvements will have the largest impact on your day-to-day cybersecurity performance.
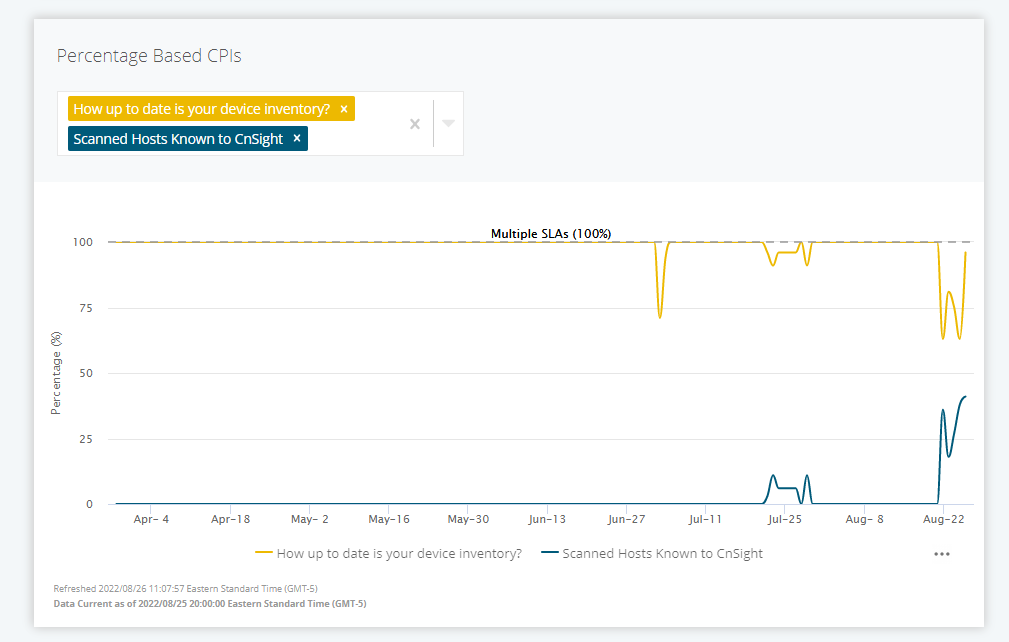
Below the performance improvement recommendations table, you will find the charts for percentage and age-based CPIs. These can be used to select any number of CPIs that you want to compare against each other to determine general trends within your data. You can compare CPIs no matter which security function they belong to, which makes this table a powerful tool in identifying performance trends and determining fluctuations in performance over time. Anomalous spikes or dips in performance can provide critical insight into process issues.
The Executive Dashboard
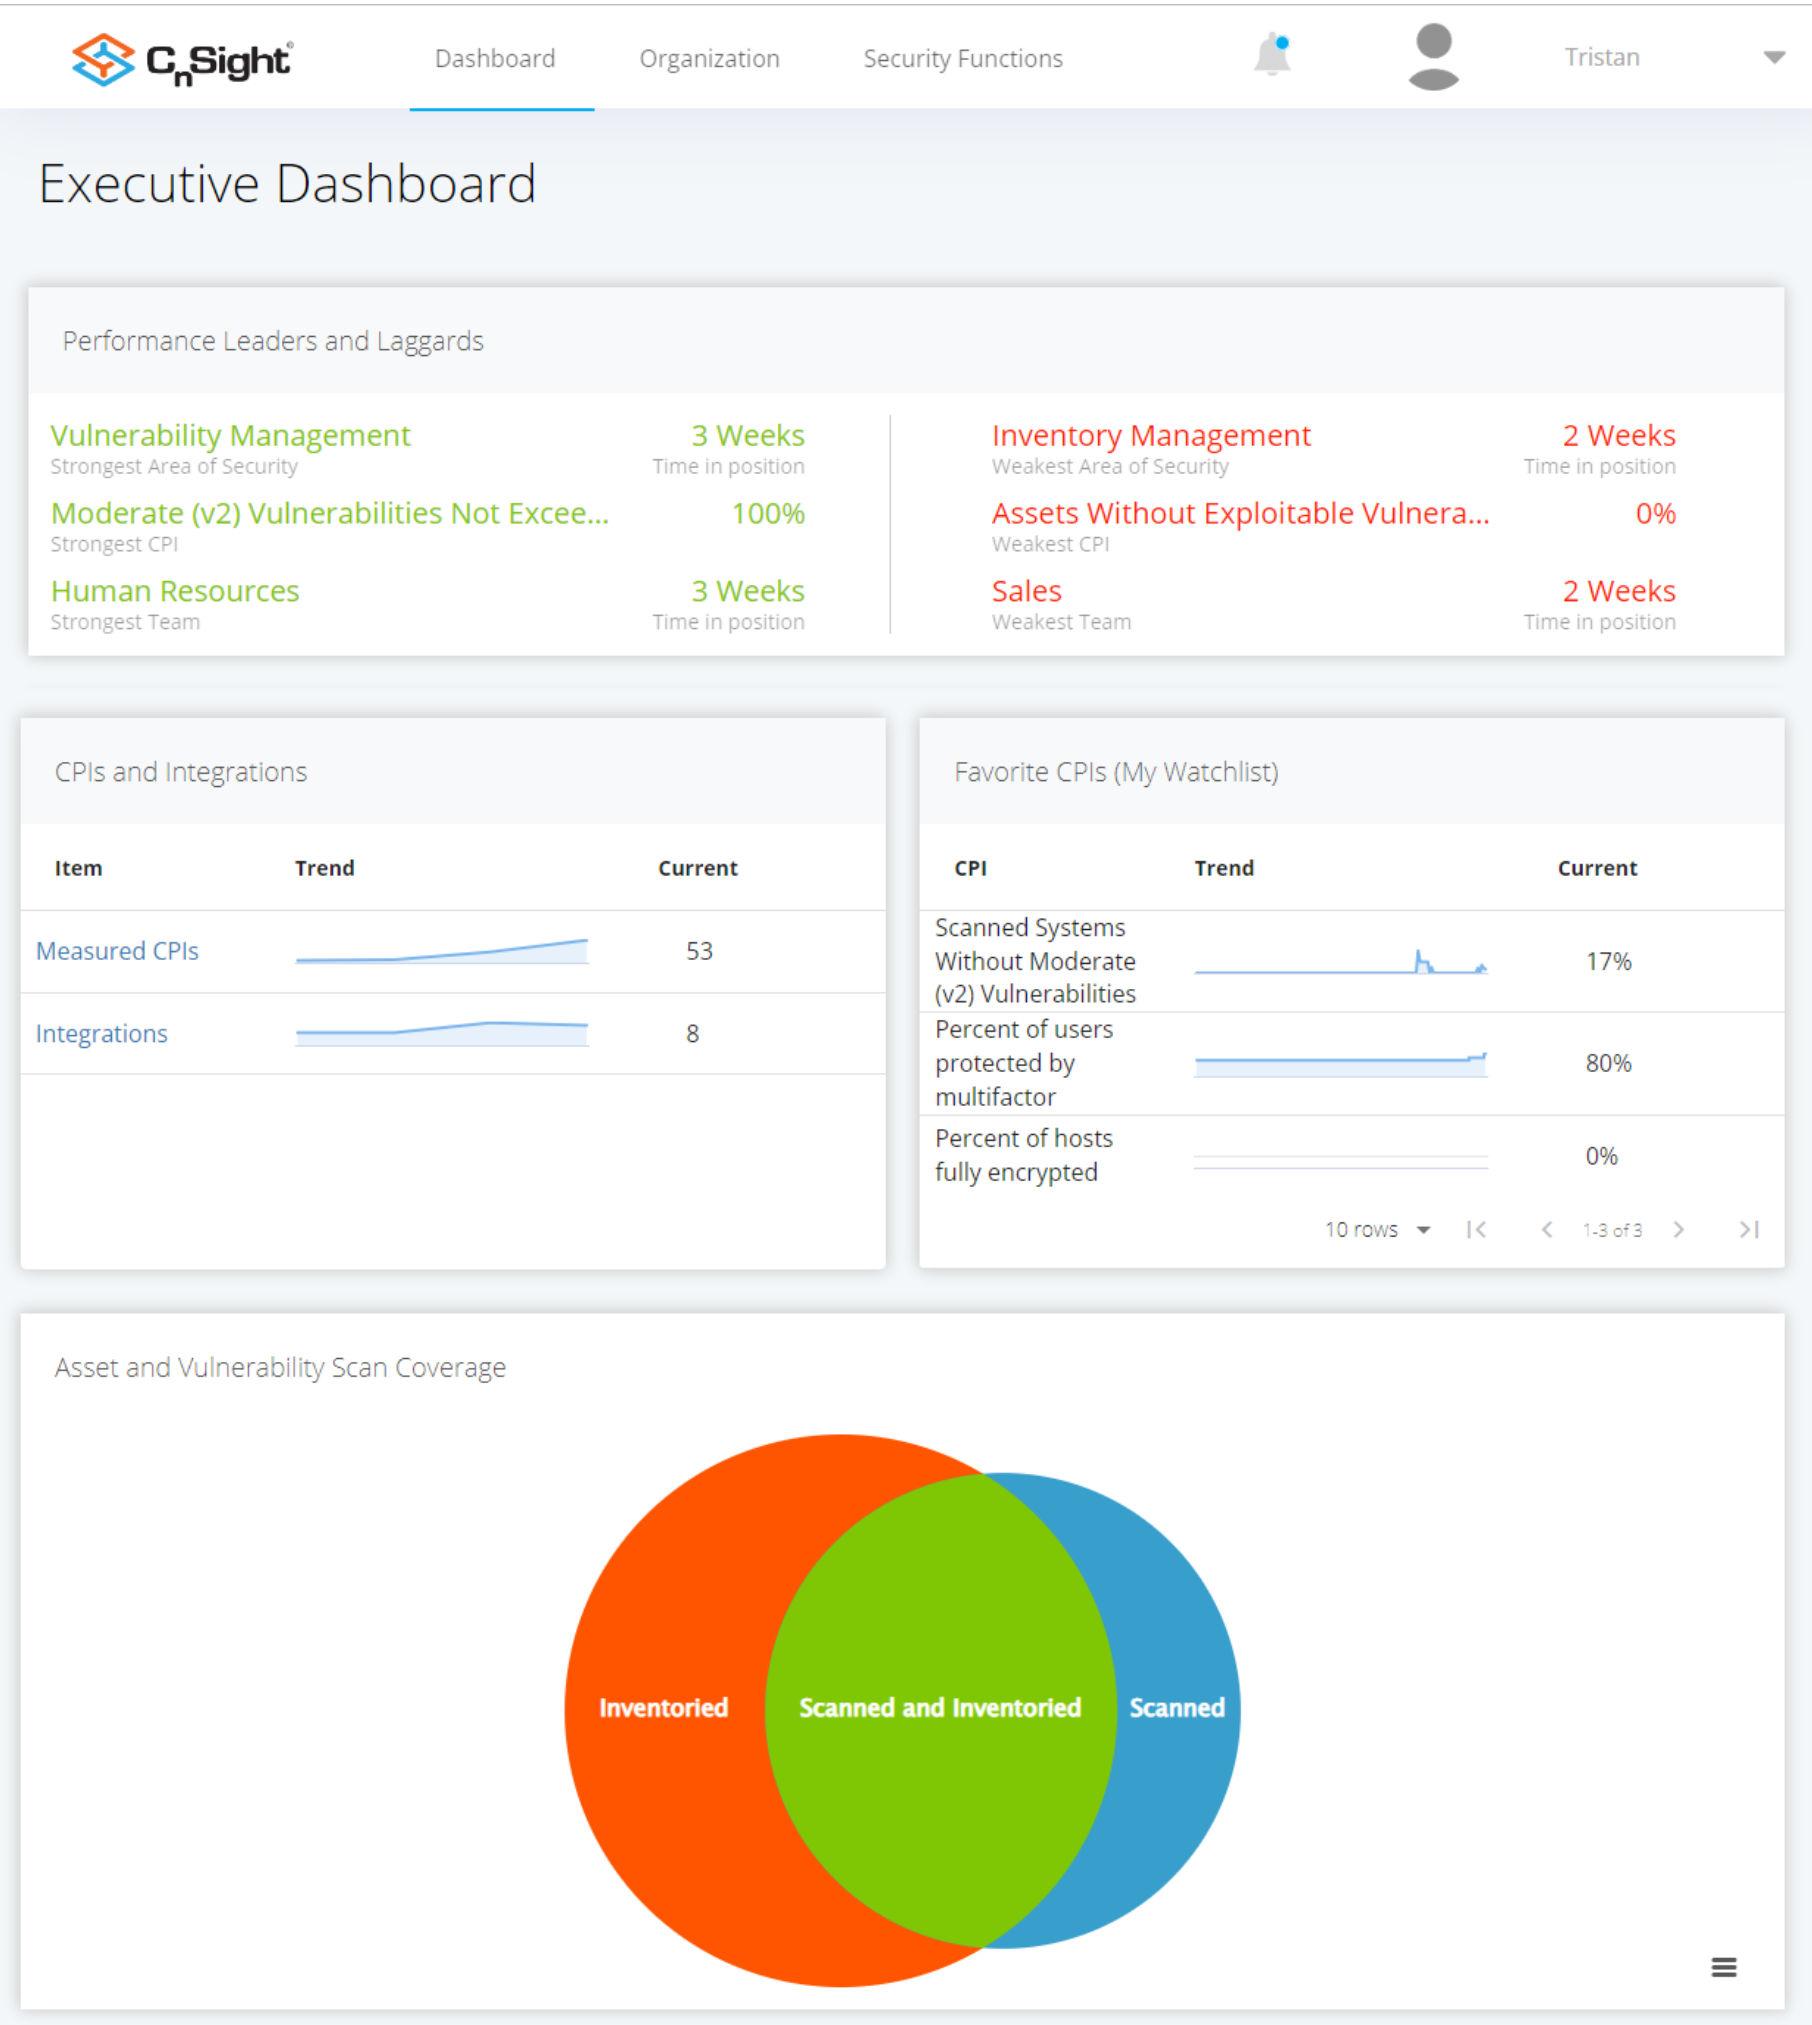
The second major dashboard in CnSight is the executive dashboard. This dashboard aims to give executives more of a high-level overview of broader trends within CnSight. The executive dashboard contains too many useful tools to give each their own spotlight, so here’s a quick summary.
- The Performance Leaders and Laggards table displays high-level information about your strongest, and weakest, performance categories in CnSight.
- The CPIs and Integrations table shows the number of currently configured CPIs as well as a historical trend so you can track growth in measurement. Just beside it is the Favorite CPIs (My Watchlist) table which displays a list of any CPIs that have been favorited for easy tracking and to identify trends.
- The Asset and Vulnerability Scan Coverage chart shows a venn diagram that depicts the number of assets that are inventoried, scanned, and the intersection to track how much of your asset inventory is known and scanned on a regular basis.
- The CPI Performance Summary section charts the overall trend of cybersecurity performance over time. It tracks the performance status of all of the CPIs in CnSight, so you can see at any historical point in time how many CPIs are achieving their SLA, are actively not achieving, or are at risk of not achieving.
- The Cybersecurity Performance Summary section breaks down and summarizes your overall cybersecurity performance and grades it based on CnSight’s internal logic. You are assigned a Performance Score (ranging from 0 to 875) to indicate overall performance, a cybersecurity maturity level (ranging from 0 to 5), and a compliance letter grade (ranging from F to A).
- Finally, the Executive Dashboard brings back an old friend; the Performance Improvement Recommendation table. Nothing has changed here, so it’ll still give you the best CPI recommendations for improving your baseline cybersecurity performance.